Birkebeiner Results
Every American Birkebeiner since 1973. How many finish, how fast, and how the weather and snow at home change race times.
The American Birkebeiner is North America’s biggest cross-country ski race, run every February through the woods of northern Wisconsin. I’ve pulled the results back to the first race in 1973, the older years read from scanned results booklets, and used them to look at who finishes, how fast, and why some years are so much faster than others.
Finishers
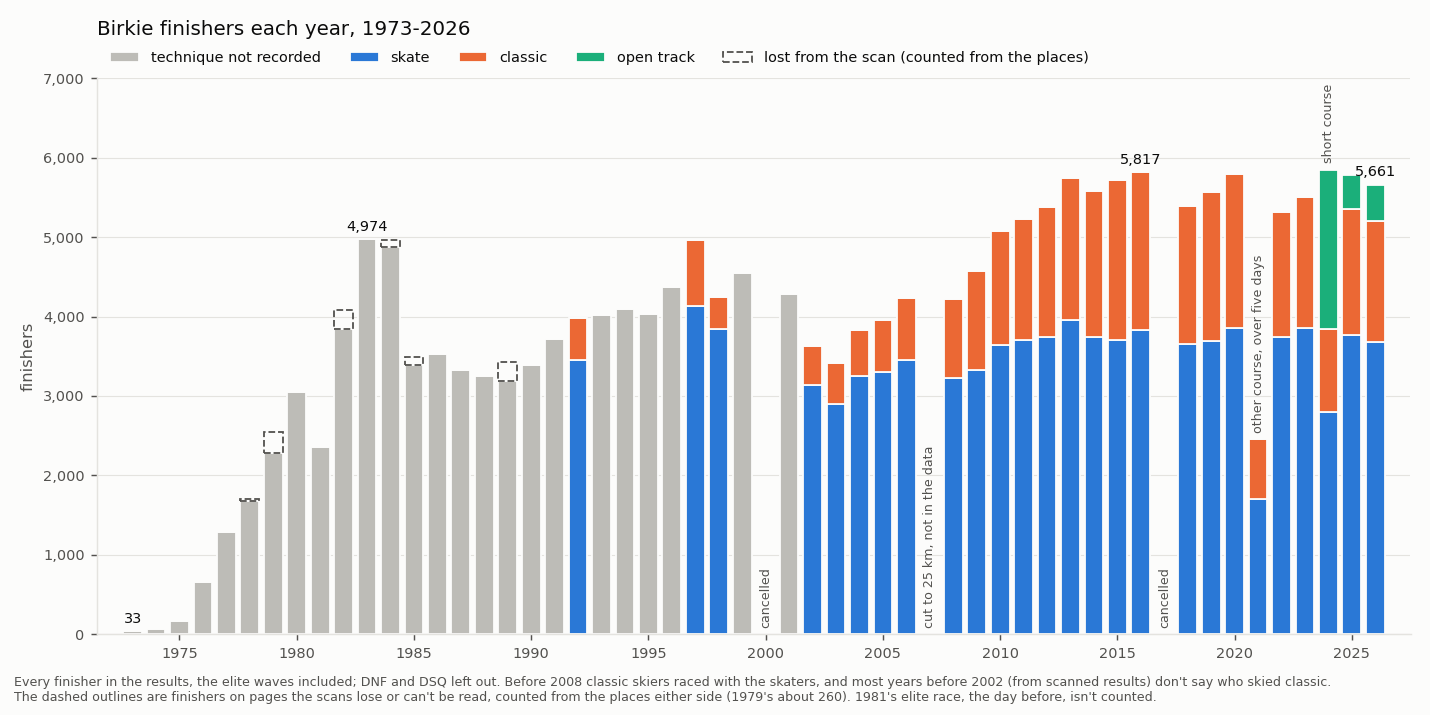
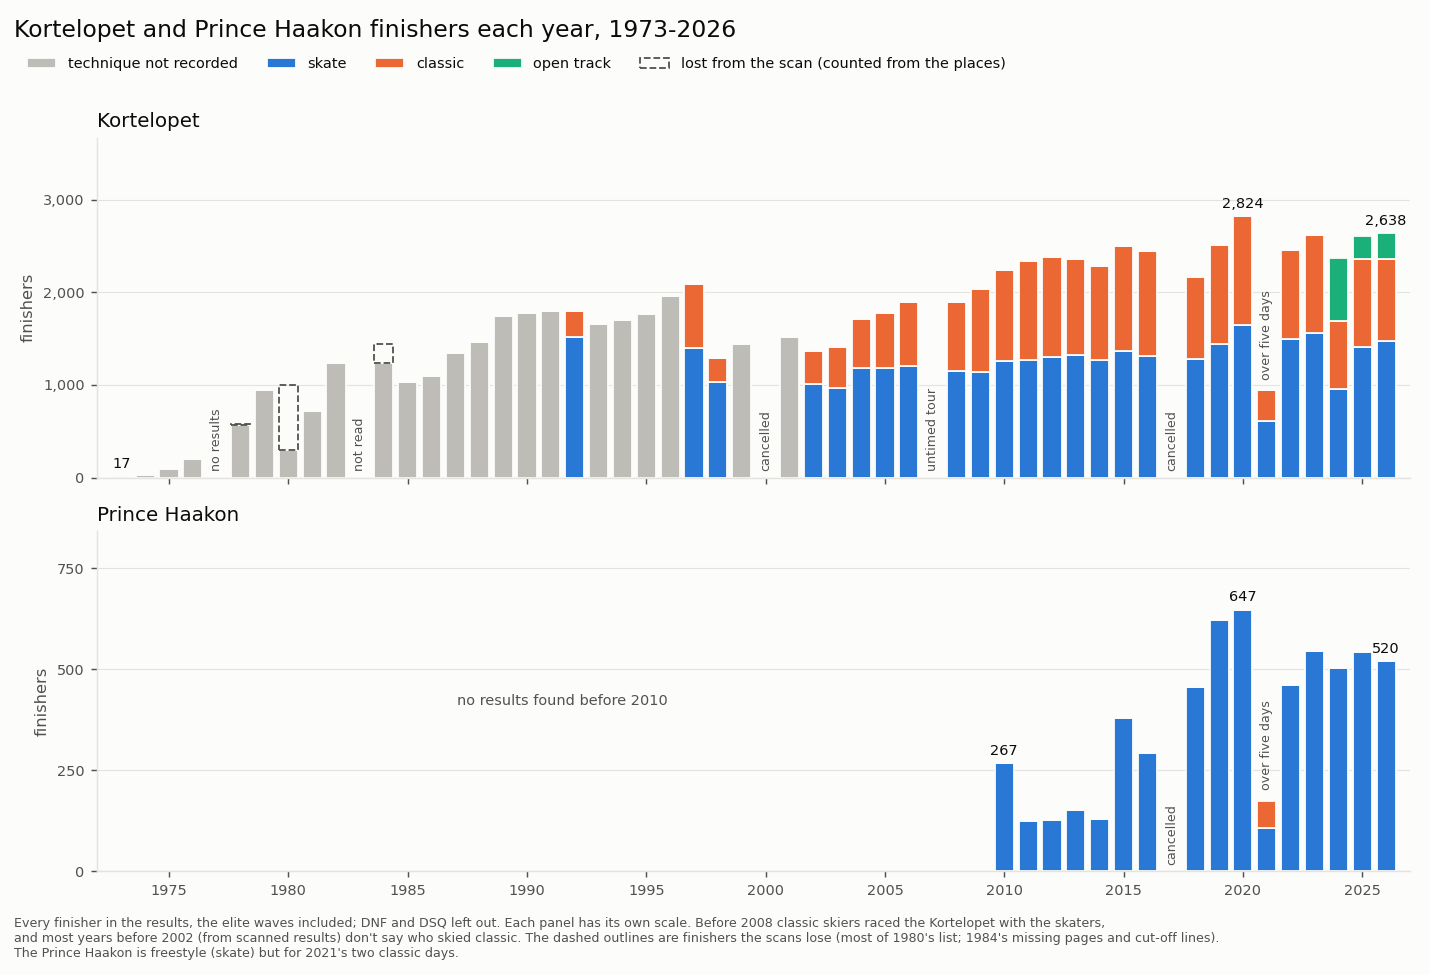
The Birkie grew from 33 finishers in 1973 to nearly 5,000 ten years later, and most years since 2010 have had between 5,000 and 6,000. Before 2008, classic skiers raced the same course as the skaters, and most results before 2002 don’t record who skied which. The Kortelopet, the shorter race run the same weekend, has grown alongside it.
Finish times
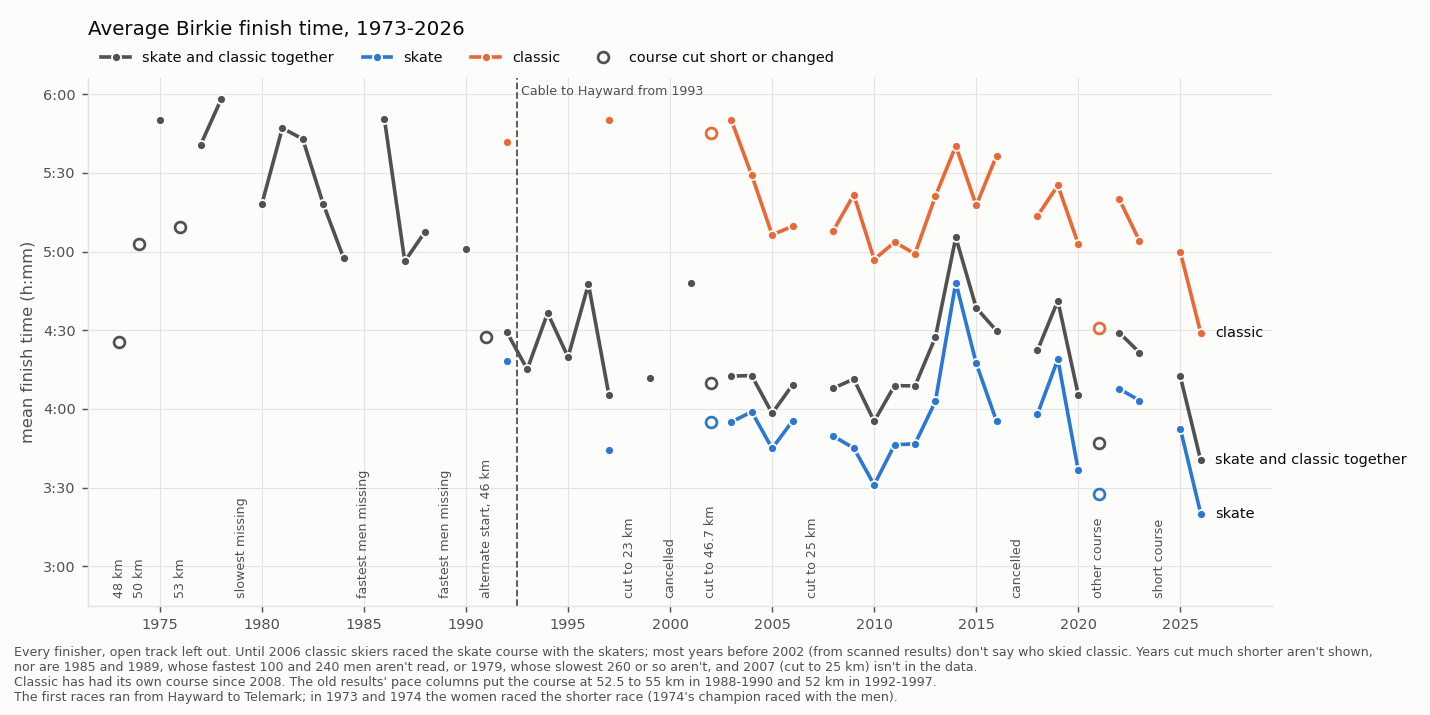
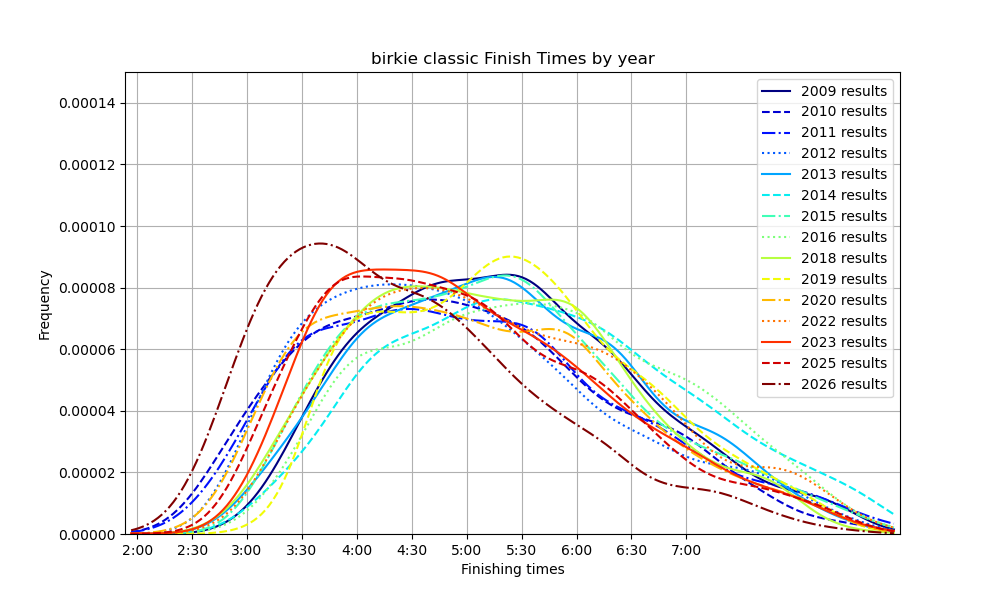
Average times differ by more than an hour between fast and slow years. The course has changed too: the first races ran from Hayward to Telemark, and since 1993 the race has run from Cable to Hayward. In the modern record, 2014 was the slowest year by far and 2026 the fastest.
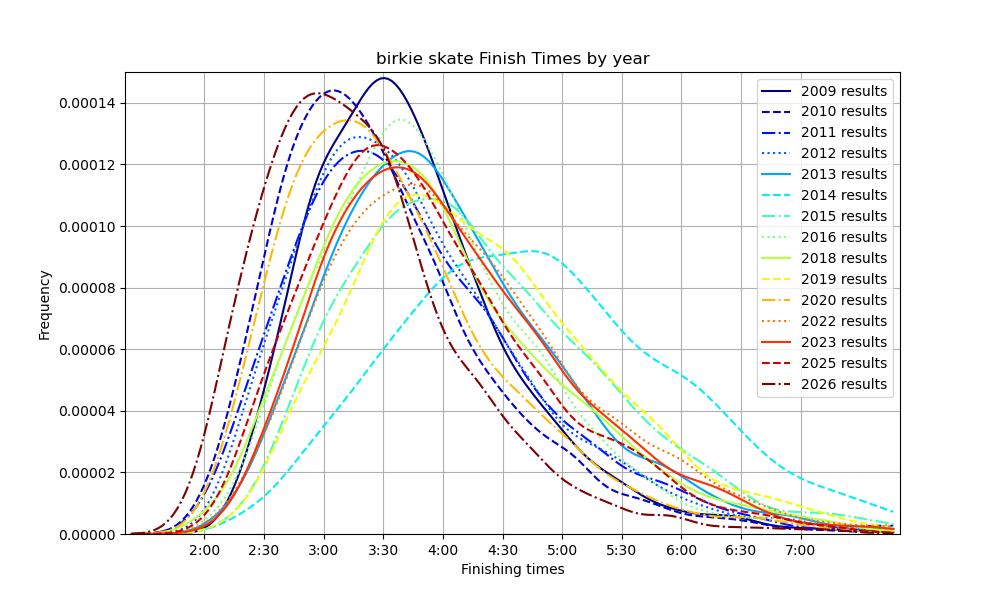
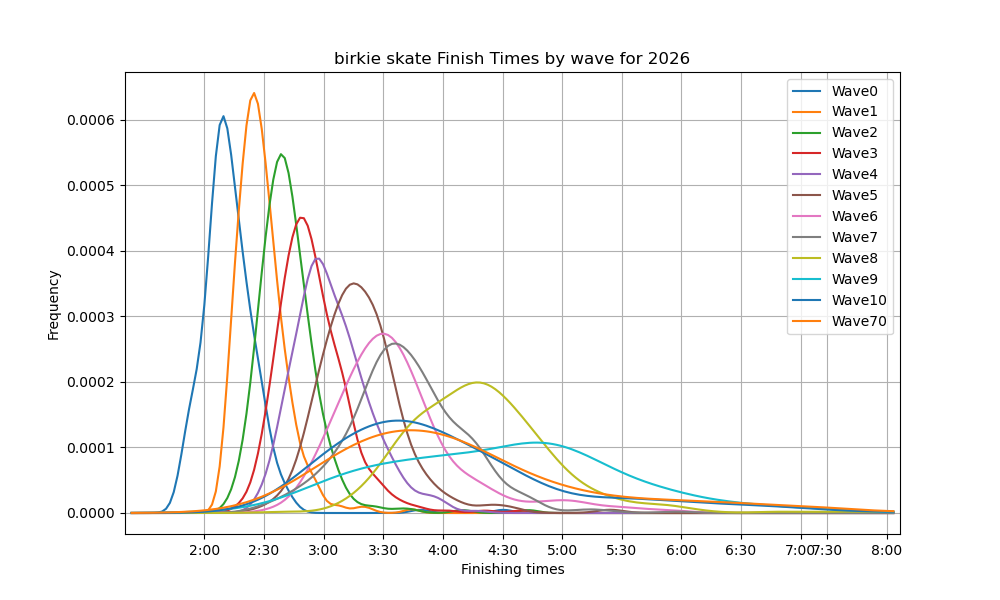
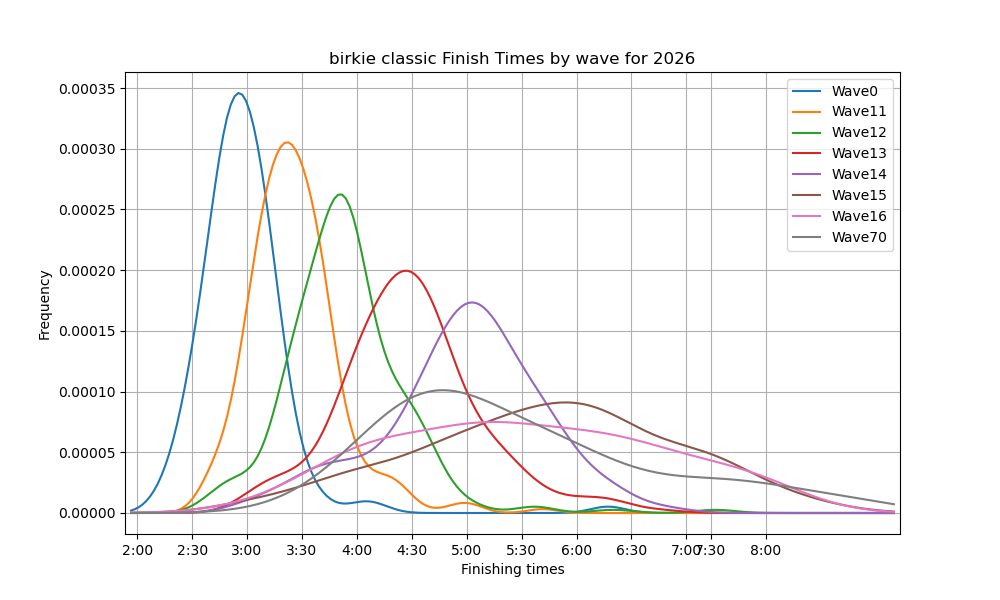
The full spread of finish times shows the same thing in more detail. Each curve is a kernel density estimate of finish times. Read its height as “how many skiers came in around this time.” The by year views compare every race since 2009, leaving out years the race was cancelled or run in a modified format. The by wave views split the 2026 race by start wave.
Weather and race speed
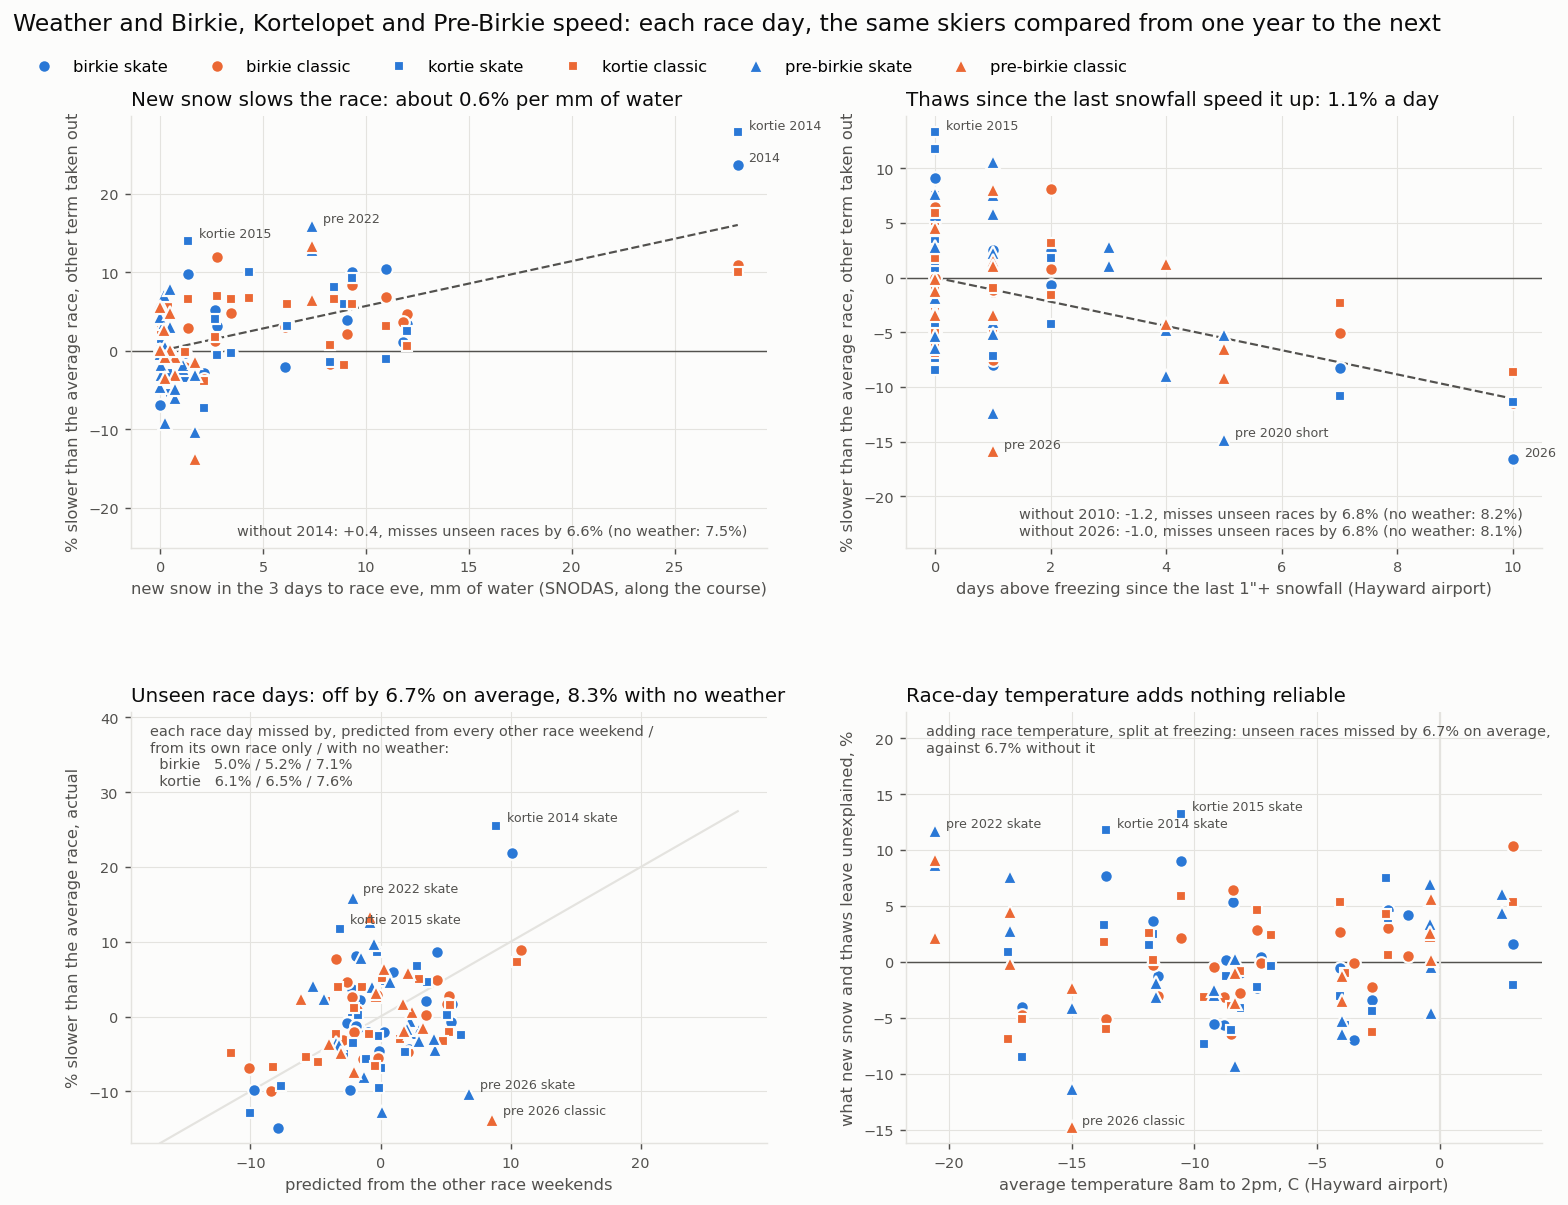
Comparing raw times across years mixes the weather with who showed up. So I model each finish time as the skier’s own ability plus that day’s conditions, their age and their experience, fit on the same skiers from one race to the next. That gives every race day a speed of its own, which I set against the weather along the course: snowfall and snowpack from SNODAS, NOAA’s daily snow model, and temperatures from the Hayward airport. The Kortelopet and the Pre-Birkie, raced on the same trail in other weather, add more race days.
Two things hold up. New snow in the three days before the race slows it, about 0.6% per millimeter of water (roughly a centimeter of fresh snow). Each day above freezing since the last real snowfall speeds it up, about 1.1% a day. Race-day temperature adds nothing reliable. Predicting each race day from all the others, the model misses by 6.7% on average, against 8.3% with no weather at all.
Does snow at home help?
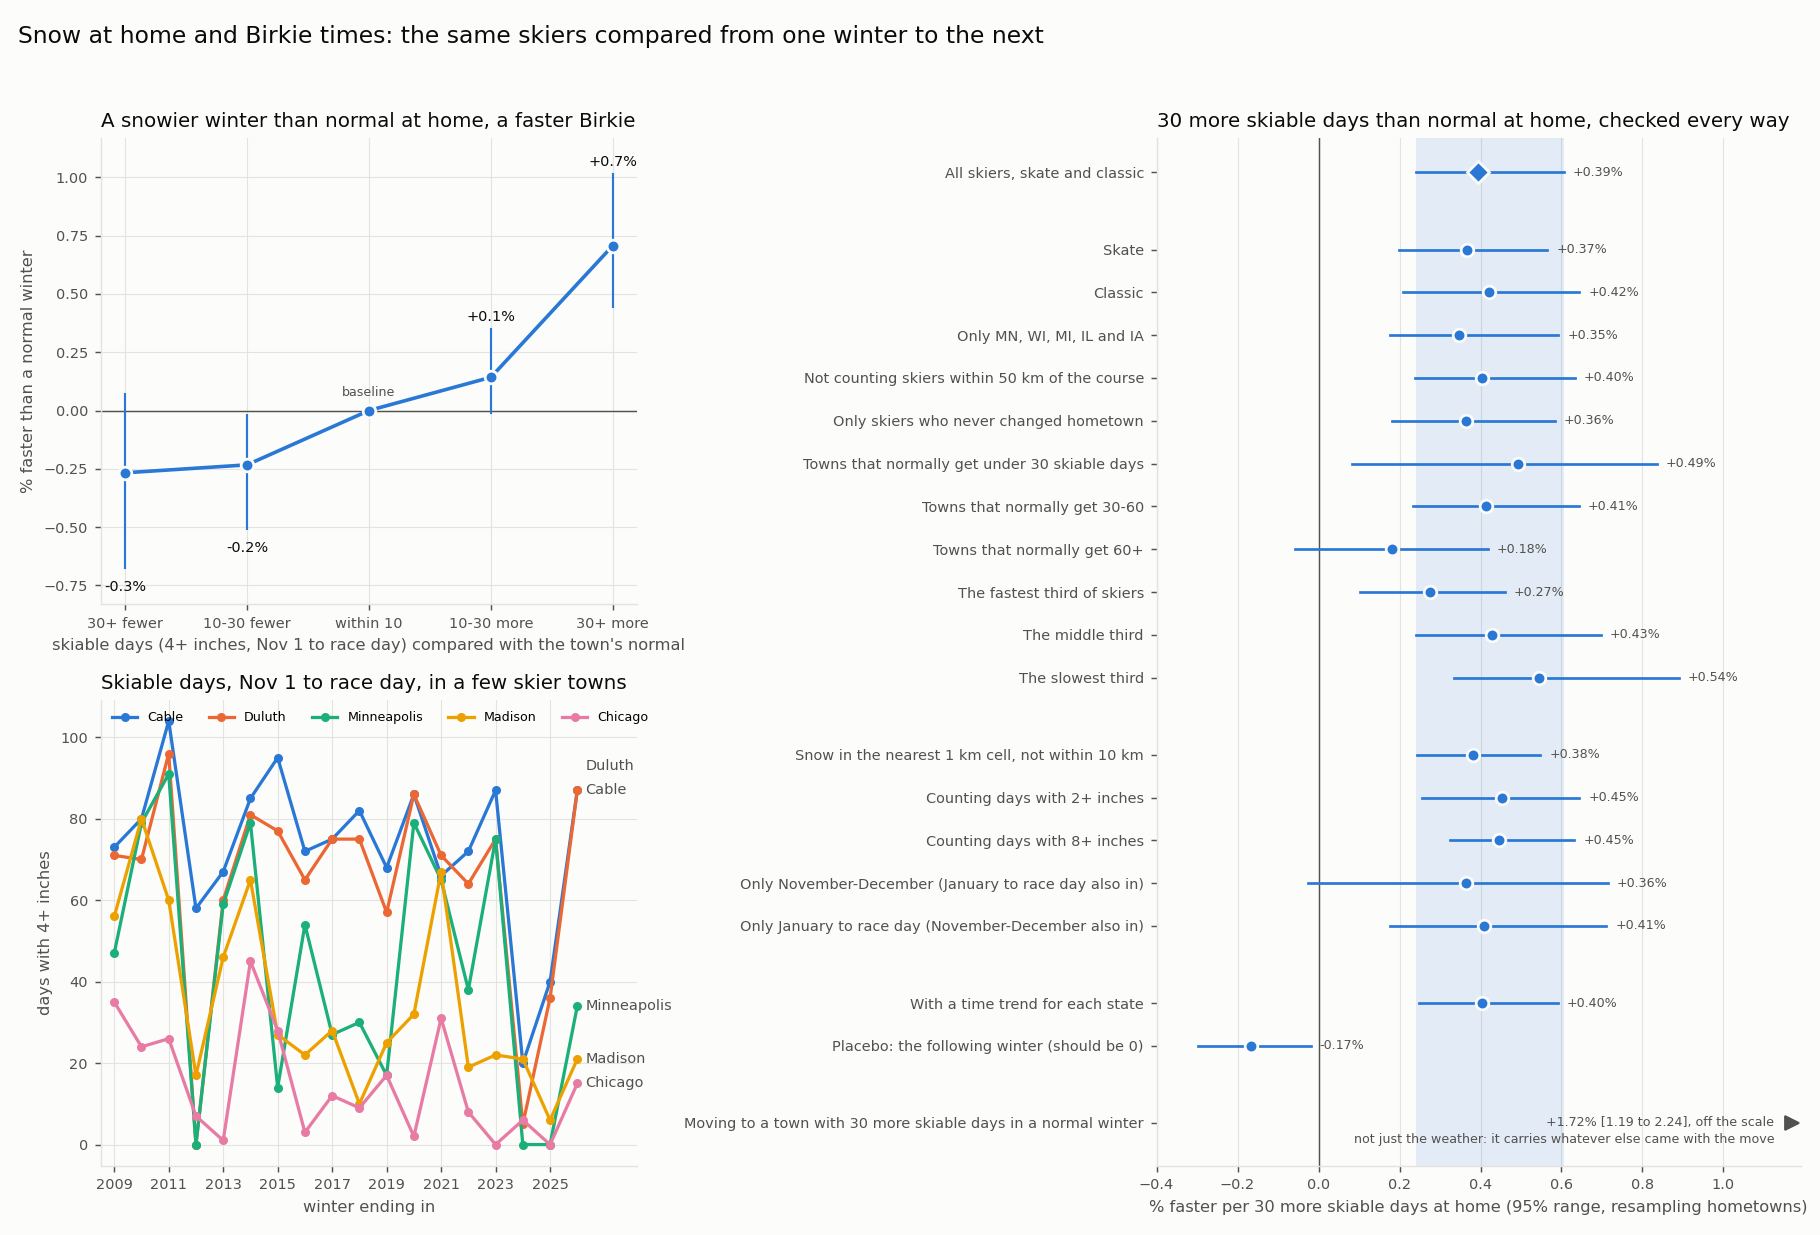
For each skier, I counted the skiable days at home (4 or more inches of snow within 10 km, from SNODAS) between November 1 and the race, and compared that with the town’s normal winter. Because the race-day conditions already take out everything the whole field shared, the effect comes only from skiers whose winter at home was snowier or leaner than usual, compared with skiers from elsewhere in the same race.
It helps, but not much. 30 more skiable days than normal is worth about 0.4% (0.2–0.6%), well under a minute for a three-hour skier. That holds for skate and classic, for skiers who never moved, and for every definition of a skiable day. The following winter’s snow, which can’t have helped, shows no gain. The effect is biggest for slower skiers and in towns that normally get little snow.
How it’s made
Results since 1999 come from the official results pages and PDFs, scraped with
Python (requests and Selenium). Earlier years are read from scanned results
booklets and magazines with Tesseract OCR and a parser for each year’s layout,
then checked against the places, times and champions list. Skiers are linked
from year to year by name, age, gender and hometown, never by finish time.
Snow data is NOAA’s SNODAS from NSIDC, and airport weather comes from the Iowa
Environmental Mesonet. Plots are made with matplotlib, and the finish-time
curves with SciPy’s gaussian_kde. The code and the yearly data are on
GitHub.
Look up a skier
Type a name to see one skier’s races since 2002, charted with the same models as above: their Birkie times with each year’s conditions taken out, every race on one scale, and how much of each field they finished ahead of. Results are matched from year to year by name, age and hometown, so two people with the same name can occasionally get mixed up.