US Transit Atlas
Transit maps for 14 US metros built from their published schedules, and dashboards comparing ridership, cost and density across US cities and against systems abroad.
The atlas started as three hand-built maps of Denver, the Twin Cities and Washington, D.C., and grew into one map that works for any city that publishes its schedules as a GTFS feed.
The maps
Pick a metro (Atlanta, Boston, Chicago, Dallas, Denver, Houston, Los Angeles, Minneapolis–St. Paul, New York, Philadelphia, Portland, San Diego, Seattle or Washington) and choose a weekday, Saturday or Sunday. The map draws every line and stop in that city’s schedules running that day, with each stop colored by how often a vehicle comes in the morning peak. Extra layers add the area the network covers, a frequency heatmap, 2020 Census population density, and route ridership where the agency publishes it.
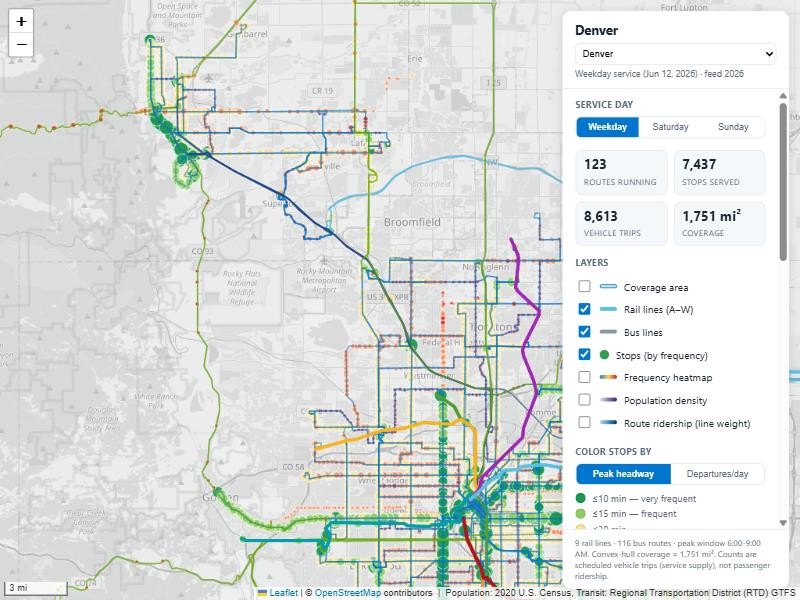
A few tools sit on top of the map:
- Probe a location. Click anywhere to count the departures, routes and people within a 400 m walk.
- Live isochrone. Pick a departure time and a stop, and see how far the schedule gets you.
- Reachability simulation. How much of the city can you reach in 45 minutes from a random station at a random time?
- Jet Lag game planner. Hiding zones and play areas for the transit hide-and-seek game, using only the frequent and rail network.
Comparing cities
The cross-city dashboard covers every US urbanized area in the Federal Transit Administration’s National Transit Database for 2024: rides, operating and capital spending, density, and cost per ride and per passenger mile. The pattern is strong: denser places ride transit much more.
Two more pages put US transit in context. The international comparison sets the 10 largest US urbanized areas beside 11 systems abroad, on cost per trip against how much people ride. The road vs transit page compares public spending on roads and transit year by year with how much people travel each way, and what a trip costs.
How it’s made
A Python pipeline finds each city’s feed in the MobilityData catalog, merges feeds where one metro has several agencies, and picks service days on which the main rail lines are actually running. It then works out frequency, coverage and reachability for the map. Population comes from the Census Bureau’s TIGERweb service, and ridership and spending from the National Transit Database on data.transportation.gov. The maps use Leaflet over OpenStreetMap. Most schedules are from summer 2026. Washington’s agency feed needs a key, so its map uses an older public copy from 2024.